
Brand Attention: Interpreting Your Score
The Brand Attention score in junbi answers a key question. It measures exactly how well your brand captures human attention. This score is based on the percentage of attention your brand receives at every moment within your ad. It helps determine whether viewers notice your brand consistently throughout the entire video.
The Strategic Value
Simply having your brand present on the screen does not guarantee that viewers will register it. If a viewer does not visually process your brand, they cannot build brand recall. Analyzing this score ensures your brand is integrated into the creative in a way that actively engages the viewer and secures long-term memorability.
How to find your Brand Attention score
- Log in to your dashboard and click on your tested video asset to view the main results page.
- Locate your overall Brand Attention summary card directly underneath the video player. This card displays your holistic percentile score.
- Scroll down to the Metrics over time section.
- Click the eye icons next to Ad Breakthrough and Cognitive Ease on the right side of the graph to toggle those lines off. This isolates the yellow Brand Attention line, allowing you to analyze your brand visibility second by second.
Note: Before junbi can calculate this score, you must configure your brand assets during the video upload phase. To learn how to set up this tracking, read our guide on How to use iconic brand detection
How brand detection works
junbi currently offers two specific types of brand detection.
- Text-Based Detection: This method identifies specific brand-related text within your video asset.
- Iconic Detection: This method uses a custom-trained model to recognize logos, symbols, and other brand elements. This ensures every visual variation is accurately detected.
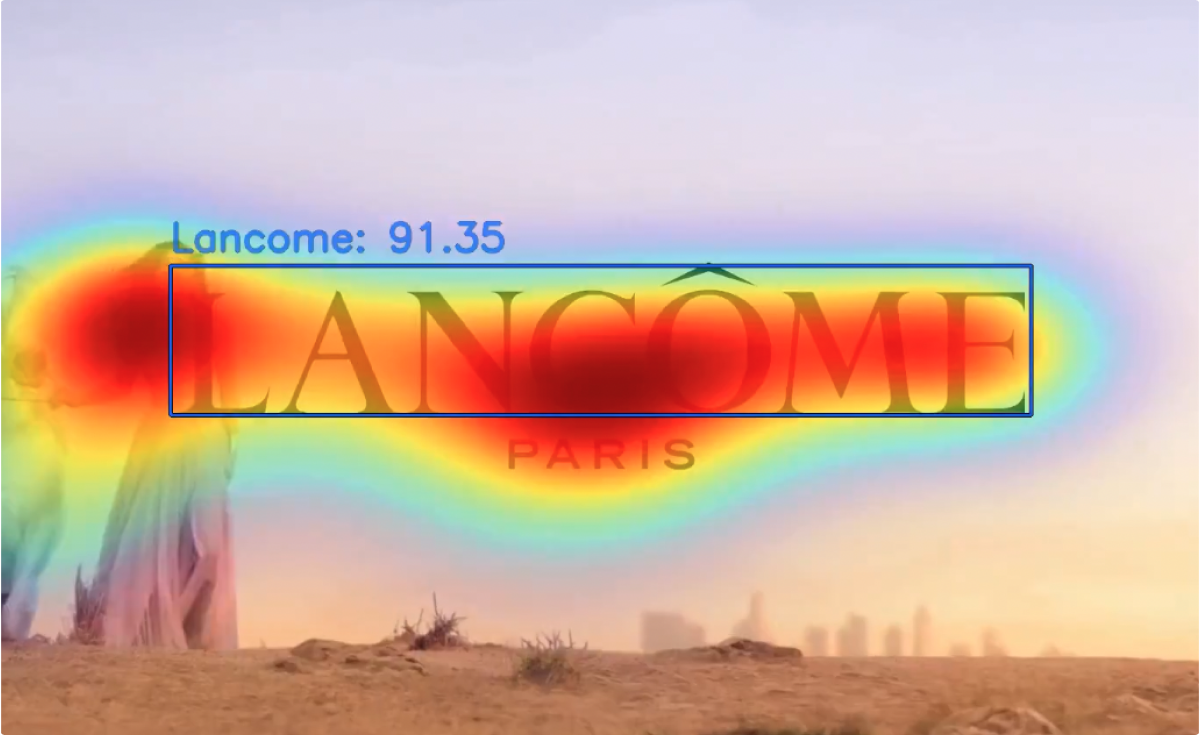
In the example below, junbi successfully detects the brand name in a Lancôme ad using text-based detection. The detected brand text is highlighted with a blue bounding box.
Understanding your score
Your Brand Attention score is displayed as a percentile. This metric compares your specific ad to a benchmark database of over 20,000 real YouTube ads.
- High percentiles: A 76th percentile score means your ad outperforms 76 percent of other ads in brand attention. A higher percentile indicates strong brand visibility and active engagement.
- Low percentiles: A lower percentile suggests your brand might not be getting enough attention. This signals a clear area for creative improvement.
💡 Pro Tip
Diagnose the timeline: If you receive a low Brand Attention score, do not guess what went wrong. Open the effectiveness drivers over time dashboard. Find the exact seconds where your logo or brand text is on the screen and check if competing visual elements are pulling attention away from your brand.