
Overall Score: Optimization Strategies
The Overall Score in junbi is an ad-level prediction that provides a holistic view of your video's performance. It is calculated as a normalized average of your three core effectiveness drivers: Cognitive Ease, Brand Attention, and Ad Breakthrough. Because the Overall Score is a single summary metric without a timeline, improving it requires you to diagnose and optimize the individual second-by-second effectiveness drivers.
The Strategic Value
A lower Overall Score indicates that your creative might struggle to capture attention or communicate your message efficiently in a real-world scenario. By breaking down the score into its core scientific drivers, you can pinpoint the exact visual elements that need adjustment. This allows you to optimize your asset before spending your media budget.
How to diagnose and improve your creative
- Verify your prediction settings: Before analyzing the data, ensure your test setup is accurate. Your Overall Score is benchmarked based on your selected Ad Type and Viewer Mode. If you upload a bumper ad but select the non-skippable format in the dropdown, your video is compared against the wrong database. Always check your setup on the ad details screen first.
- Open the Metrics over time dashboard: To see exactly what needs improvement, you must look at the second-by-second scores for your three effectiveness drivers. Review this chart to identify the precise moments in your ad where the scores drop below the benchmark.
-
Optimize for Cognitive Ease: Aim to create a video that is easy for the brain to process. Avoid too many competing visual elements, rapid scene changes, or cluttered backgrounds. A strong asset provides a clear, central focus point for the viewer. A good example of cognitive ease is shown below: The product is shown by itself with one clear focus point in the centre of the screen, making it easy for the viewer to know where to direct their attention.

Compared with a poor example, where the woman is not the clear focus point for the viewer and the attention is drawn away by the phone and background scenery.

-
Optimize for Brand Attention: This metric measures how much visual attention goes directly to your brand assets. To improve this score, ensure your logo or product is noticeable. Make the logo clear, large, and place it in a central area of the screen. Below is a good example of brand attention, where the big and high-contrast logo is placed perfectly in the center of the screen, successfully capturing a significant share of the viewer's visual attention.

Compared with a poor example, where the brand text is placed at the very bottom and receives zero attention because the viewer is completely distracted by the large text and competing visuals above it.

-
Optimize for Ad Breakthrough:
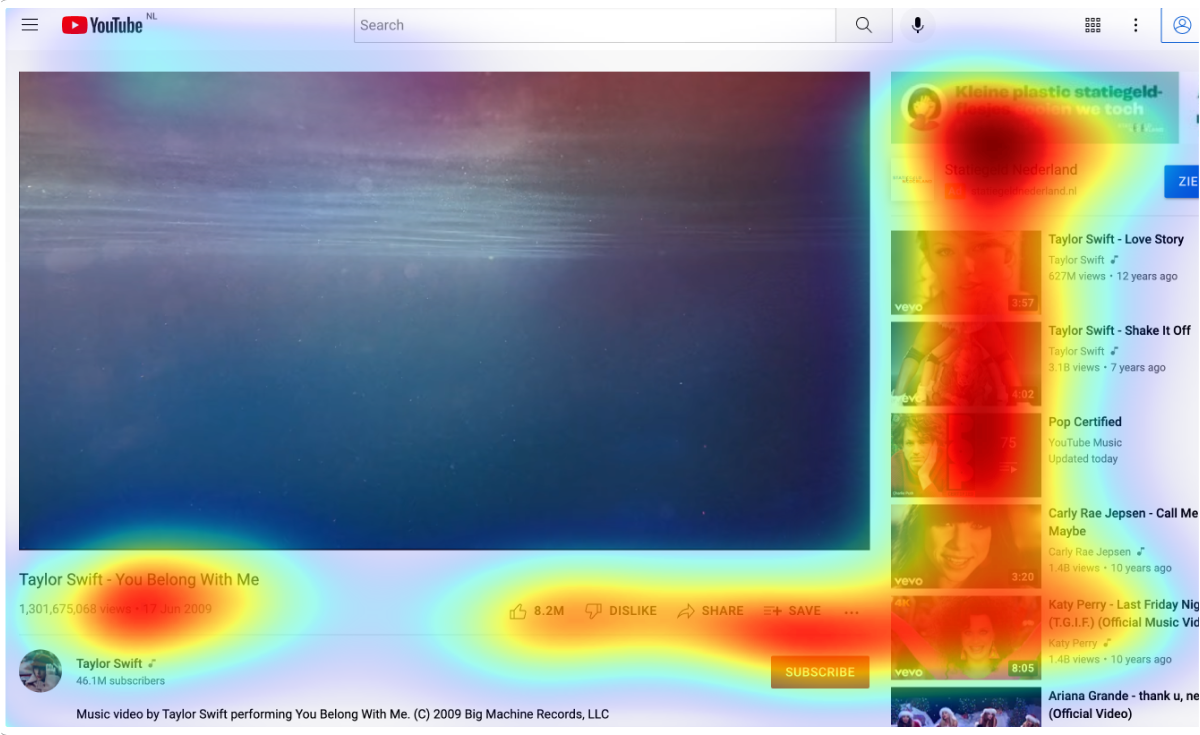
This score measures your ad's ability to grab human attention away from contextual platform distractions. To improve it, use clear human faces, establish a single focus point, and use large text with high contrast against the background. A good example of ad breakthrough is shown below, with bright colours and clear focus points.

Compared with a poor example, which does not have clear focus points and does not make use of bright, contrasting colours.


💡 Pro Tip
Test specific edits: Because junbi is fast and requires no human participants, you can easily test multiple versions of your ad. Do not change everything at once. Edit one specific scene that drops in your Metrics over time dashboard, upload the new version, and compare the Overall Score of both videos side-by-side.